
What is GammaJuice? Algorithmic Pattern Detection for Small-Caps
What is GammaJuice?
How algorithmic pattern recognition identifies high-probability setups in small & mid-cap stocks
GammaJuice is a technical analysis platform that uses algorithmic pattern recognition to identify high-probability trading setups in small and mid-cap stocks. Instead of predicting where prices will go, we detect when specific technical conditions have historically led to explosive moves.
The Problem We Solve
Retail traders face three recurring challenges:
- Information overload - flooded with tips, social media chatter, and stock picks that lack context
- Poor timing - hearing about a stock AFTER the move has already happened
- No measurable edge - everyone has access to the same charts, so what separates winners from losers?
Our approach: Scan thousands of stocks daily looking for a specific technical pattern called a Bollinger Band Squeeze - and only alert when conditions align across three pillars.
The Squeeze Pattern Explained
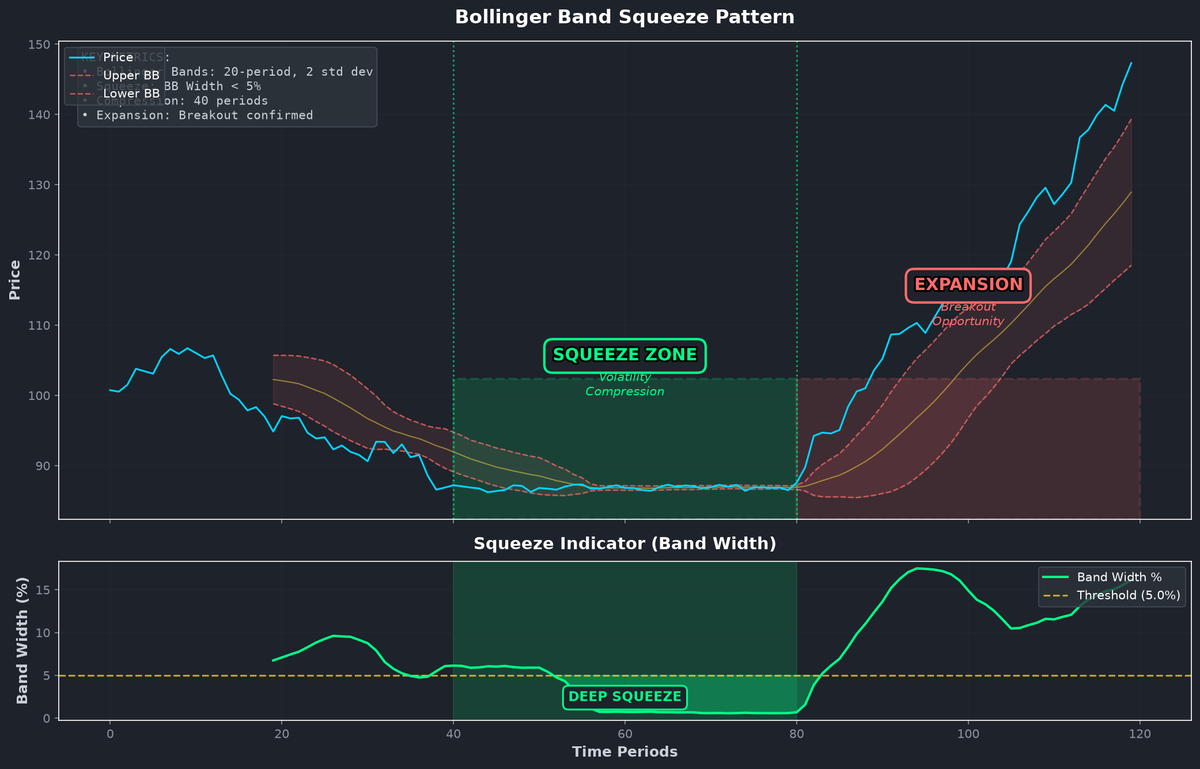
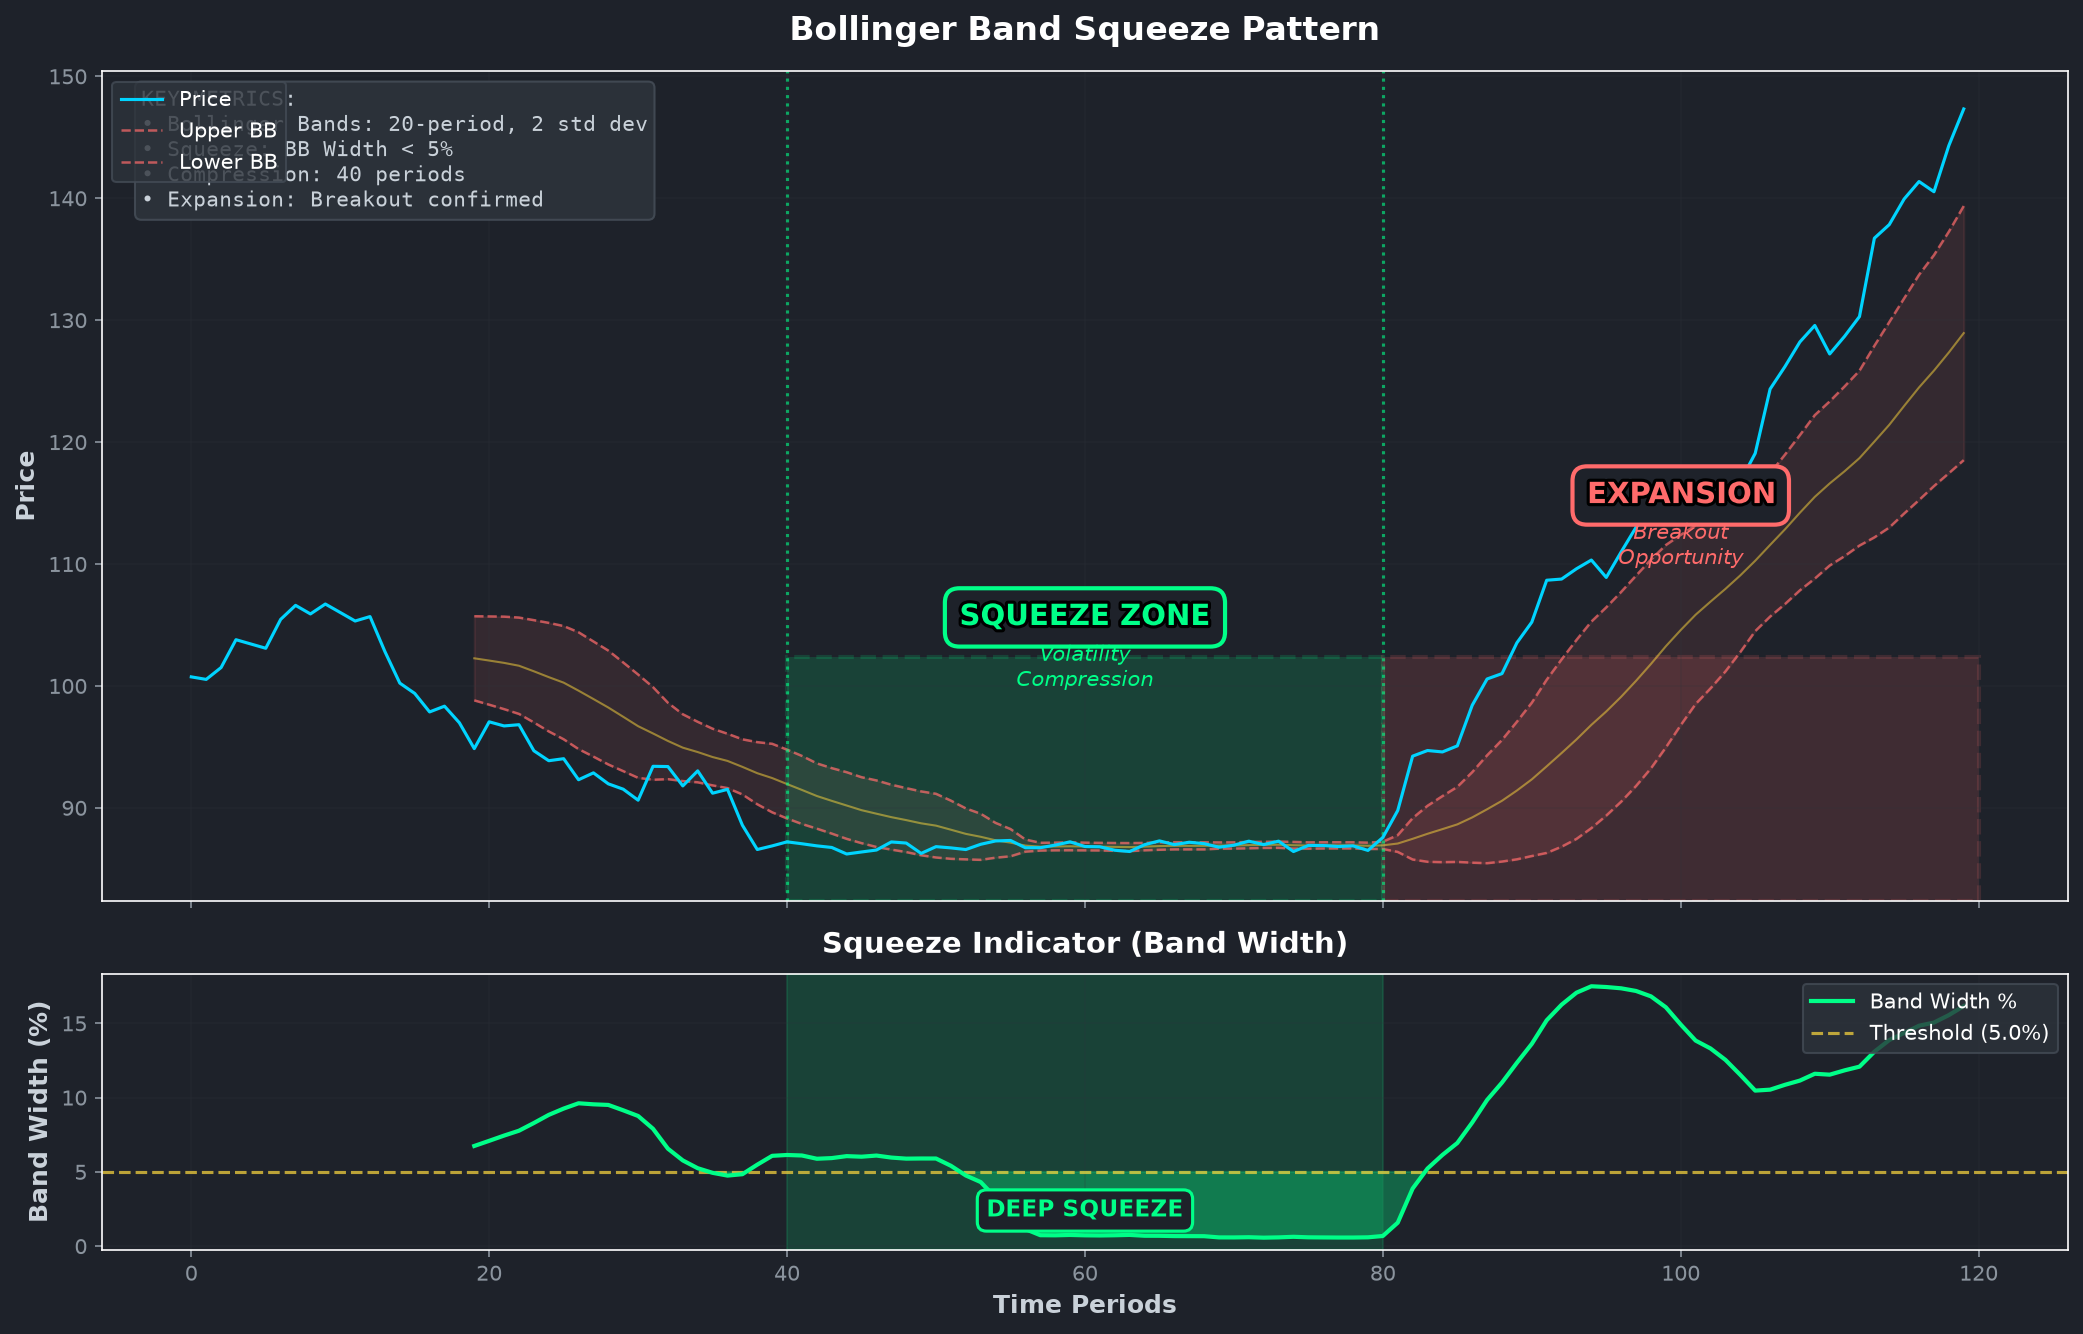
The chart above illustrates our primary signal. Notice the three distinct phases:
Phase 1: Normal Volatility
Price action moves within standard Bollinger Bands. Bands are at normal width. This is "baseline" behavior.
Phase 2: Compression (The Squeeze)
Bollinger Bands contract dramatically - we call this deep squeeze territory - when band width drops below 5%. Price becomes confined. It looks boring. But energy is building.
Why compression happens: The market is "indecision." Buyers and sellers are balanced. But this doesn't last. Markets must expand after contracting.
Phase 3: Expansion (The Breakout)
Bands rapidly widen as volatility surges. Price breaks out with momentum. This is where the significant move occurs - often 30-100%+ in the case of small-caps.
Our Three Pillars
We only alert when a stock shows evidence across all three:
1. Compression
- Bollinger Bands narrow below 5% of price
- Compression lasts 30-40+ trading days minimum
- Stock gets "coiled up" like a spring
2. Momentum
- Price shows strength relative to its moving averages during compression
- RSI, MACD, or other momentum indicators ticking up
- The stock isn't dying - it's just quiet
3. Risk/Reward
- Defined entry, stop-loss, and target levels
- We aim for 2-3:1 reward-to-risk minimum
- Position sizing: risk no more than 1-2% per trade
What We Share Publicly
Transparency where it matters:
- Our framework - the three pillars, the squeeze pattern, the methodology
- Real setups - when our algorithms find a match, we alert subscribers
- Transparent levels - every signal includes entry, stop, and target
- Performance data - win rates, average gains, historical results
What Stays Proprietary
Competitive edge requires keeping some things private:
- Exact algorithmic weights and formulas
- Our complete scanning universe and filters
- Proprietary indicators and signal refinement logic
Think of it this way: We tell you the recipe (compression + momentum + risk/reward), the ingredients we use (Bollinger Bands, moving averages), and we show you our results. But the exact cooking technique (our proprietary scoring system) stays internal.
Thresholds We Use
You asked for the specifics. Here they are:
| Metric | Threshold | Rationale | |--------|-----------|-----------| | Bollinger Band Width | < 5% of price | "Deep squeeze" territory | | Compression Duration | 30-40+ periods | Longer compression = bigger move | | Win Rate Target | 60-70% | Consistent profitability | | Reward:Risk | 2-3:1 minimum | Positive expectancy | | Position Risk | 1-2% per trade | Capital preservation |
These aren't arbitrary numbers. They're based on historical analysis of which squeeze setups actually produce moves. The longer the compression, the higher the probability. The wider the eventual expansion, the better the reward.
Risk Management
Every signal we publish includes:
- Entry zone - where to get in (not a single price, but a zone)
- Stop-loss - absolute maximum you can lose (always defined, always honored)
- Targets - 1, 2, or 3 levels where we take profits along the way
Our philosophy: Consistency over home runs. A 60-70% win rate with 2:1 reward/risk means you can be wrong 4 out of 10 times and still be profitable. That's the edge.
Who This Is For
Active traders who:
- Trade small and mid-cap stocks with sufficient liquidity
- Can execute within minutes when signals fire
- Understand that not every trade wins
- Follow stop-loss discipline (no exceptions)
- Want technical-based edge, not tips or rumors
This is NOT for:
- Buy-and-hold investors who rebalance quarterly
- People looking for "guaranteed returns" (impossible)
- Traders uncomfortable with 1-2% position sizing rules
- Anyone who expects to win every trade
How to Get Started
- Watch our public signals on Twitter/Telegram to see live examples
- Paper trade the setups for 30 days before risking real capital
- Track your own P&L so you know if the system fits your style
- Start small when you go live - 1% per trade max
Data sourced from Yahoo Finance and FRED. All analysis is educational. Not financial advice.